From version 5.0.5 the quiz plugin WatuPRO comes with a basic bar chart shortcode that can be used to display a chart in the final page of the quiz.
The chart can be used for two main purposes:
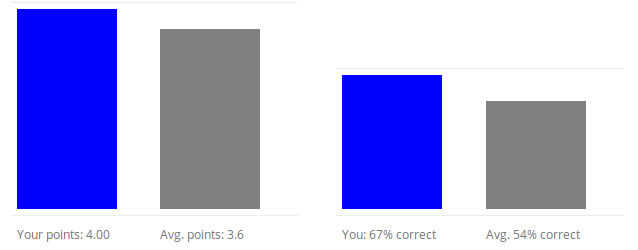
a) to show how your result compares to the averages of other quiz takers on the same quiz.
b) to show your points vs. maximum possible points chart.
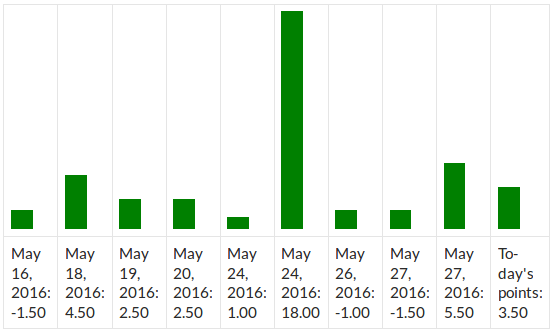
c) to show how your current attempt compares to your previous attempts (for logged in users)
Here are examples of the chart:
Yours vs Average Results:
Your own results overview:
(this mode requires at least WatuPRO 5.1.5.5)
This basic chart does not require the Reporting Module. Below is a more detailed explanation how to use the shortcode:
Please note this shortcode can be used only in the quiz output box. At the moment it won’t work anywhere else including certificates.
Using the shortcode
The shortcode to be included in the final screen is [watupro-basic-chart]
It can be used without any attributes in which case will produce a chart like in the image above. You can however use several attributes to customize it:
show – this attribute defines whether to show both charts, only the points chart, or only the percentages chart. The possible values of this parameter are: ‘both’, ‘points’, ‘percent’, or ‘max_points’. When the value is max_points the chart will display your points vs. maximum possible points bars.
your_color – the color of the bar with user’s stats (your points, your % correct answer). Defaults to blue. Can accept color as a word or as hexadecimal value.
avg_color – the color of the bar with average or maximum stats (avg. points, avg % correct answer). Defaults to gray. Can accept color as a word or as hexadecimal value.
bar_width – the width of the bar in pixels. Defaults to 100.
average – “show” or “hide” depending on whether you want to show the bar with the average values from everyone (or maximum points, depending on “show”). If you omit the argument, it will be shown. If the parameter show is set to max_points, the maximum will always be shown.
The following attributes are not documented in the Help page because using them improperly can cause on-screen errors:
overview – defines how many attempts to show in total and will work only for logged in users. Defaults to 1, i.e. by default it shows only the latest attempt. The max. is 10.
If the parameter show is set to max_points, then overview is always switched off to 1.
your_points_text – defines the text written under “Your points” bar. Defaults to “Your points: %s”. You can change it but it must always include the “%s” variable.
your_overview_points_text – When overview is more than 1, this is the text that will show for the previous attempts. Defaults to “%s: %s”. You can change it but it must always include the “%s” variables because they will be replaced with date and points.
avg_points_text – defines the text written under “Avg. points” or “Max. points” bar. Defaults to “Avg. points: %s”. You can change it but it must always include the “%s” variable.
your_percent_text – defines the text under “Your % correct” bar. Defaults to “You: %d%% correct”. Must always include the “%d” variable.
your_overview_percent_text –When overview is more than 1, this is the text that will show for the previous attempts. Defaults to “%s: %d%% correct”. Must always include the “%s” and “%d” variable.
avg_percent_text – defines the text under “Avg. % correct” bar. Defaults to “Avg. %d%% correct”. Must always include the “%d” variable.
round_points – set to 1 if you want to not use decimals and have all points rounded.
Here is an example usage including several arguments:
[watupro-basic-chart show="points" your_color="red" avg_color="#00FF00" your_points_text="You: %s points" avg_points_text="Avg.from all users: %s points"]