Here we are with another lengthy data-driven guide – this time on surveys. Based on our experiences with WatuPRO and results of our customers, there are some quite interesting conclusions that will help you be more successful with your surveys.
How To Construct The Survey

Of course the main part of your work on every survey is actually creating the questions. This is super individual and depends a lot on your specific needs, niche and goals. There are however some general tips which you should follow to increase the usefulness and the visitor-to-response ratio:
- Always collect some kind of pivot / demographic information. You need to know some basics about your respondents that you can later segment on. Typically demographics like age, sex, location, and so on. Most surveys are useful if you can break down your users on at least one criteria, usually at least 2 or 3. This is not an absolute requirement but you will almost never see a deep survey that does not segment the respondents by some kind of demographic or other pivot criteria.
- When defining the demographic questions, consider the expected volume of the responses. Of course you can’t always know in advance how many responses you are going to get. But if you are running a survey on a small site without any advertising budget or a private survey in a membership site you might be happy with a few hundred responses. In this case splitting your demographics in too many pieces wouldn’t make sense because it will give you statistically insignificant information. On the other hand a survey with hundreds of thousands responses can allow you to do super precise segmentation. For example by age – having the user type the exact age instead of selecting a range. Still, even if this case you need to think how useful the data will be in such format and how easy to read.
- Enough questions. As with other quizzes there are no strict rules here. The most important thing is that you ask enough questions to collect the data you need. Try to stick to the lower number to avoid annoying your respondents.
- Sections. Longer surveys do need to be paginated and split into question categories. This is extremely important to avoid losing user’s attention. Surveys with thematic sections tend to perform best.
- Simpler questions. Unlike knowledge quizzes which usually benefit of using versatile question types, surveys are doing much better with simpler questions. In fact one of the best performing surveys contain only single choice / multiple choice questions or a likert scale. So, stick to simplicity in most cases. Slider questions work good though.
- Quantitative questions. Surveys are used mostly to analyze volumes of data and draw conclusions. So you should in general avoid questions like essays, fill the blanks, and similar. You need responses that can be summarized and that allow you to run reports on them and probably draw charts.
This is by no means a complete list but should be enough to help you create a survey which is better than most others.
Marketing The Survey

Image by deepak pal
Ideally you will have an existing audience to run your survey on. This could be social media followers, blog subscribers, existing customers, demo users, free product users, mailing lists subscribers…
Surveys usually do not directly generate revenue so marketing them with a hard earned cash is usually not done by small businesses and individual entrepreneurs.
When the survey is sent to an existing audience it’s also usually getting good percentage of responses. Of course only if it’s intriguing as a topic and type of questions.
PPC and regular ads are typically out of question for most of us. There are some paid services focused explicitly on surveys where each response may cost you a dollar or so. This can still be expensive if you need a couple of thousands of replies and the quality won’t be always good because the respondents are paid to take surveys. So it’s much preferred if you can get a free and organic reach to really interested participants.
Here are several posts with ideas how to promote your survey:
If you decide to spend money on attracting participants make sure to monitor closely the quality of their responses. Quickly stop spending if it looks like you are paying for answers from bots or people who just randomly click on the answers so they “complete” the survey and get a few cents for the “work”.
Provide Some Incentives

Photo credit
Surveys are typically most useful for the one who runs them and less for the respondent. Unlike quizzes where the user learns something about them or completes a course, gets a certificate, etc, the survey respondent typically gets a thank you 🙂 And sometimes but not always they can see the result of the survey up to this moment – or later when it’s considered completed and published.
For this reason you may get low responses on surveys. Incentives help to increase the survey responses. Here are some ideas:
- Direct payment. I would avoid it. Not only because it may cost you a lot but also because people who respond to surveys to get paid have one primary motive – to get paid. They are often more interested to respond fast and get the money rather than to provide good meaningful responses.
- Discount codes. This is much better. First, you will hopefully make some sales. Second, the survey will be taken by users who are interested in your products or services. And this is what you usually want – not some general answers from the whole internet.
- Lottery prizes / giveaway. This is slightly better than making a direct payment because you’ll spend less money. Better give a free product or service rather than money. Again, mostly because you’ll attract better respondents.
- A personality result or personalized advice. Now, this is not always possible but maybe you can combine your survey with a personality result. And have it calculate some kind of a personality type or advice to the user based on their responses. Bingo! You’ll receive excellent answers and will get them for free. Think along the lines “answer this survey and find out what’s the best… for you”.
- Certification. Sometimes you can combine the survey with a knowledge test. This works best if the goal of your survey is to figure out how knowledgeable are the respondents on a given topic but may also work to collect demographic or opinions data. If you can do such a combination, the certification for the taken test is your incentive. And the best of it is that users will answer really carefully.
If you have experience with other incentives – either as a survey runner or a respondent, please share in the comments.
How to make the survey more attractive: ask for an opinion
This is in line with incentives but not exactly. Here the incentive itself is to give an opinion 🙂 People love doing it. So surveys that ask for opinions perform best: voting surveys, surveys that evaluate trust in political figures, sport forecasts or financial forecasts, etc. Make people feel their opinion is important and they’ll be happy to answer your survey.
Even if you don’t need the opinion for your analysis it’s always a good idea to include some questions that ask for it. This won’t hurt your data but will make people eager to participate. In fact more surveys do need exactly user’s opinion: their preferences to specific products or services, the likelihood to do something, their personal habits, and so on.
Get the most of these leads
Even though you probably don’t think about the survey respondents as “leads” in fact they are. The fact that they spent the time and attention into your survey prove that they like you (or your site/company, etc) and are interested in what you have to offer. Unless you paid them to participate in the survey of course – which is why, again, I don’t like the idea to pay for survey responses.
So treat these people as leads. Ask for their email address and for agreement to contact them. One of the easiest ways to get their agreement is to promise sending them the survey findings when the analysis is done (and of course, fulfill your promise!). These people spent the time to answer the survey – of course they want to know how everyone responded to it!
Then later you can send them any kind of offers related to the survey topic. Send them another survey, incentives, anything. Use the survey as your marketing funnel for other stuff that you have to offer.
The most important ways of survey data analysis
There are a lot of very elaborated ways you can extract data from a survey. Also, you won’t need most of them 🙂 Usually unless you are running some kind of quite complicated science you’ll need some of these analysis:
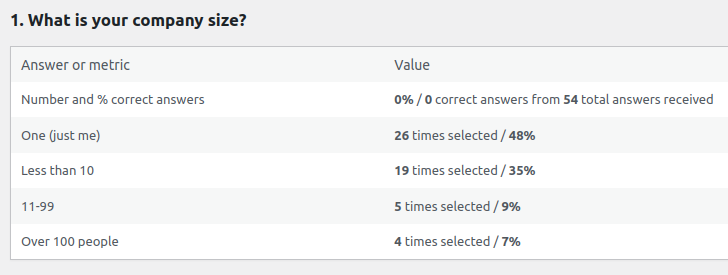
- Cumulative data per question. This will show you how many and what percentage of users have selected each answer on each question. So if a question contains 3 answers you need to know how many of the respondents selected A, B, and C. This is a typical feature of most survey softwares (yes, available in WatuPRO survey bundles) and it is one of the most useful ones.
- List of answers per question. In addition to see everyone’s individual answer sheet you may want to have a look at a list of everyone’s answers on every question.
- Cross-tabulation stats. This is one of the most useful advanced analysis methods. It will show you the intersection of the different questions and answers. Said simpler, you would usually use it to see what percentages of each demographic segment of your respondents have selected the different answers on a selected question. You can of course segment on any criteria like interest, income, product used, and so on.
- Statistics per question category if your survey has different categories.
- Points collected and point averages. Not all surveys assign points to answers but sometimes this is an extremely useful method to run quantitative stats on questions or question categories. For example if you use slider questions the averages can give you insights – about customer’s satisfaction with some features or products, about the level of interest for different services, and so on.
You can find some ideas for specific survey analysis here.