Monthly Archives: November 2021

Display Custom Tooltips in Chart.js 3

Chart.js is a lovely library for interactive charts. It’s probably the best free and open source library for JavaScript based charts available at the moment.

For a project that creates custom charts based on data collected with our quiz and survey WP plugin we had to create custom tooltips that appear when the mouse hovers any of a linear chart datapoints.

The Problem

The default tooltips in chart.js unfortunately allow only text. For our project we needed to include fully featured HTML code – a pop-up with an image and text had to appear when the mouse is hovered on a data point.

The Solution In Action

Here is what you will achieve after following this kind-of a tutorial:

Info about One

Content, including images can be placed here.

Close

Info about Two

Content, including images can be placed here.

Close

Info about Three

Content, including images can be placed here.

Close

Info about Four

Content, including images can be placed here.

Close

Info about Five

Content, including images can be placed here.

Close

You see how the tooltips are fully featured HTML boxes with text, image(s), and a close button.

The Solution in Code

For this post we just created a hardcoded chart with 5 data points and 5 divs with information about them. It’s of course more likely that you will use some dynamic data from a database, etc. So you will need to loop through the data and generate parts of the HTML and JS code. This however does not change the logic that we will describe here.

First, let’s create some basic HTML. You need a div with information (tooltip contents) for each data point. The important thing here is to place these divs AND your chart canvas in a wrapper with position:relative. Each of the info divs has position:absolute. This allows you to properly display the divs pretty close to each data point.

<style type="text/css">
    .pointinfo-container {
        display:none;
        padding: 7px;
        background: white;
        width: 200px;
        border: 1pt solid black;
        position: absolute;
    }
    </style>

    <div style="position: relative;"><!-- This is the wrapper -->
        <div id="pointInfo1" class="pointinfo-container">
            <h3 class="pointinfo-event-title">Info about One</h3>			  		
            <span ><a href="#" onclick="closePointInfo(1);return false;">Close</a></span>
        </div>
        
        <div id="pointInfo2" class="pointinfo-container">
            <h3 class="pointinfo-event-title">Info about Two</h3>
            <span ><a href="#" onclick="closePointInfo(2);return false;">Close</a></span>
        </div>
        
        <div id="pointInfo3" class="pointinfo-container">
            <h3 class="pointinfo-event-title">Info about Three</h3>
            <span ><a href="#" onclick="closePointInfo(3);return false;">Close</a></span>
        </div>
        
        <div id="pointInfo4" class="pointinfo-container">
            <h3 class="pointinfo-event-title">Info about Four</h3>
            <span ><a href="#" onclick="closePointInfo(4);return false;">Close</a></span>
        </div>
        
        <div id="pointInfo5" class="pointinfo-container">
            <h3 class="pointinfo-event-title">Info about Five</h3>
            <span ><a href="#" onclick="closePointInfo(5);return false;">Close</a></span>
        </div>	
        
        <div><canvas id="myChart" style="display: block; box-sizing: border-box; height: 306px; width: 612px;"></canvas></div>
    </div>

For clarity we have omitted most of the contents of the div.

And now, more important, the JavaScript.

var myChart = null;
    jQuery( document ).ready(function() {
            var ctx = document.getElementById('myChart').getContext('2d');
            myChart = new Chart(ctx, {	
            type: 'line',
            data: {
                labels: ['One', 'Two', 'Three', 'Four', 'Five'],
                datasets: [{
                    label: 'Demo Chary',			
                    data: [22, 33, 17, 67, 8],
                    fill: 'false',
                    borderColor: '#052148',
                    backgroundColor: 'white',			
                }],
            },
            options: {
                aspectRatio: 3,
                responsive: true,
                maintainAspectRatio: true,
                layout: {
                    padding: {
                        left: 30,
                        right: 40,
                        top: 70,
                        bottom: 10
                    }
                },
                legend: {
                    display: false
                },
                plugins: {
                    
                },
                tooltips: {
                    enabled: false
                },
        
                onHover: (e) => {	
                    			
                      var meta = myChart.getDatasetMeta(0);
                      datapoints = [
                      	 {'x' : Math.round(meta.data[0].x), 'y': Math.round(meta.data[0].y)},
                      	 	  	 
                      	 {'x' : Math.round(meta.data[1].x), 'y': Math.round(meta.data[1].y)},
                      	 	  	 
                      	 {'x' : Math.round(meta.data[2].x), 'y': Math.round(meta.data[2].y)},
                      	 	  	 
                      	 {'x' : Math.round(meta.data[3].x), 'y': Math.round(meta.data[3].y)},
                      	 	  	 
                      	 {'x' : Math.round(meta.data[4].x), 'y': Math.round(meta.data[4].y)},
                      ]; 
                        
                        
                       if(typeof(datapoints) === 'undefined') return false;
                    const canvasPosition = Chart.helpers.getRelativePosition(e, myChart);
                        
                   jQuery(datapoints).each(function(i, elt){
                   	   let j = i+1;
                   	  
                    	if(elt.x >= canvasPosition.x - 10 && elt.x <= canvasPosition.x + 10 && elt.y >= canvasPosition.y - 10 && elt.y <= canvasPosition.y + 10) {		            		
                    		jQuery('#pointInfo' + j).css( {position:"absolute", top: canvasPosition.y - 50, left: canvasPosition.x - 50});		            		
                    		jQuery('#pointInfo' + j).show();
                    	}
                    });
        
                },			
            } // end options
        }); // end chart		
       
        // on resize we hide all boxes to avoid messy view
       jQuery( window ).resize(function() {
         jQuery('.pointinfo-container').hide();
        }); // end resize		
        
    }); // end document ready

Most of the standard Chart.js code is pretty clear. You need to focus only on the onHover function. Let’s repeat it here with lots of comments:

onHover: (e) => {	
                    	 // this gets the meta data of the chart to figure out the coordinates of each data point
                      // This part is very important and specific to Chart.js version 3. In version 2 the syntax will not work.		
                      var meta = myChart.getDatasetMeta(0);
                      datapoints = [					  	 	 
                      	{'x' : Math.round(meta.data[0].x), 'y': Math.round(meta.data[0].y)},
                      	 	  	 
                      	 {'x' : Math.round(meta.data[1].x), 'y': Math.round(meta.data[1].y)},
                      	 	  	 
                      	 {'x' : Math.round(meta.data[2].x), 'y': Math.round(meta.data[2].y)},
                      	 	  	 
                      	 {'x' : Math.round(meta.data[3].x), 'y': Math.round(meta.data[3].y)},
                      	 	  	 
                      	 {'x' : Math.round(meta.data[4].x), 'y': Math.round(meta.data[4].y)},
                      ]; 
                        
                        
                       if(typeof(datapoints) === 'undefined') return false;

                           // Once we know the datapoints position, we also need to get the x/y of the canvas
                    const canvasPosition = Chart.helpers.getRelativePosition(e, myChart);
                        
                   jQuery(datapoints).each(function(i, elt){
                   	   let j = i+1;
                                  // Remember, we are hovering the mouse. Don't expect the user to be exact and give some allowance which will display the info when the user is close to any
                        // of the data points. Here we give allowance of 10 pixels around each point.
                    	if(elt.x >= canvasPosition.x - 10 && elt.x <= canvasPosition.x + 10 && elt.y >= canvasPosition.y - 10 && elt.y <= canvasPosition.y + 10) {
		            	// and the stuff here is rather straightforward: set the element position around the datapoint position	
                    		jQuery('#pointInfo' + j).css( {position:"absolute", top: canvasPosition.y - 50, left: canvasPosition.x - 50});	
                                // then show	            		
                    		jQuery('#pointInfo' + j).show();
                    	}
                    });
        
                },

The most important part above is getting the data points coordinates. You need to do this inside the onHover function. In Chart.js version 2 you could do it in a document.ready handler, but this no longer works correctly.

The data points information is retrieved through the getDatasetMeta() method of the library. The argument is the dataset number, staring at 0. (Our chart has only one dataset).

Each data point is in the resulting object property meta.data. It is an array of datapoint objects and you need the properties x and y of each of them.

Finally, you need a function to close the pop-up when the user clicks on the close()

function closePointInfo(cnt) {
        jQuery('#pointInfo' + cnt).hide();
    
        // if all point infos are hidden, make sure the show all mode is show
        let anyOpen = false;
        jQuery('.pointinfo-container').each(function(i, elt){
            if(jQuery(elt).is(":visible")) {
                anyOpen = true;
                return;
            }
        });
        
    }

That’s it. If you have used this somewhere, let us know in the comments!

Arigato PRO 3.2

The new version of Arigato PRO is here with a lot of improvements and fixes:

  • Added “% unsubscribed” users stats for every mailing list.
  • Added option to mass-pause email automation messages.
  • Formidable Forms integration available. More info: https://blog.calendarscripts.info/formidable-forms-integration-in-arigato-pro/
  • You can now send Webhooks to Zapier or other services when someone subscribes to or unsubscribes from a mailing list.
  • Added a configurable option to store and show subscribers IP address. Do this at your own responsibility depending on your local privacy law.
  • “Send after X o’clock” is now available also for newsletter emails.
  • Added option to automatically log in the user to the site when auto-subscribing them as WP user.
  • Added option to mass activate / deactivate mailing list subscribers.
  • The unsubscribe reason from the unsubscribe poll (if any) will be included in the optional unsubscribe notification email message.
  • The Settings page has been reorganized in logical tabs.
  • Added a shortcode to display a public newsletter archive. You will find the shortcode on Your Newsletters page.
  • Optional tags added to subscribers data for searching in the administration. The tags can also be used in segmentation if you have the Intelligence module installed.
  • Implemented Google reCaptcha v3.
  • Values can be passed as URL parameters to prepopulate a subscribe form. Learn how: https://blog.calendarscripts.info/passing-values-through-url-parameters-in-arigato-pro/
  • Improved handling of emojis in email messages.
  • Custom presets can now be stored in wp-content/uploads/arigatopro-presets folder so you don’t lose them on plugin updates.
  • The raw email log now can show the emails for a start / end date interval.
  • A hook added when an email is sent.
  • Added validation for file type when uploading subscribers.
  • Improvements to handling daily mail limits.
  • Added personal data eraser for GDPR compatibility.
  • Removed session usage for displaying on-screen messages.
  • Displayed field name for a second method of integrating custom fields in Contact form7. This way you can make the fields validate as required and also have these fields sent in the email message that CF 7 sends to you. It will also make the field get saved in Data Tensai.
  • Dynamically get the DB collation when the plugin is activated.
  • Added optional last name to the Contact form 7 integration.
  • [Gozaimasu module] Added A/B tests on message subjects. Learn more at https://blog.calendarscripts.info/a-b-testing-of-email-message-subjects-in-arigato-gozaimasu/
  • [Gozaimasu module] The “sticky bar / ribbon” design now also have option for showing only after the visitor has spent some time on the site.
  • [Fixed bug] After reordering the Settings page changes made in it were not being saved properly.
  • [Fixed bug] Name field was not showing an asterix when it was a required field.
  • [Fixed bug] Checking only some checkboxes on Manage Subscribers page did not reveal the mass action buttons below the table.

Zapier Webhooks in Arigato PRO

From version 3.2 the WordPress newsletter and email marketing plugin Arigato PRO supports sending webhooks to Zapier and any other services that work accept webhooks.

You can learn more about Zapier’s implementation of webhooks here.

What are Webhooks in Arigato PRO?

Hooks will be notified when an user subscribes to or unsibscribes from a selected mailing list. The notification will contain the user’s email address, name, and up to 3 custom parameters that let you any other predefined data.

Webhooks are used by all kind of low code / no code services to further connect your mailing list with other apps. For example you can add your subscriber to a CRM, to a membership site, and so on.

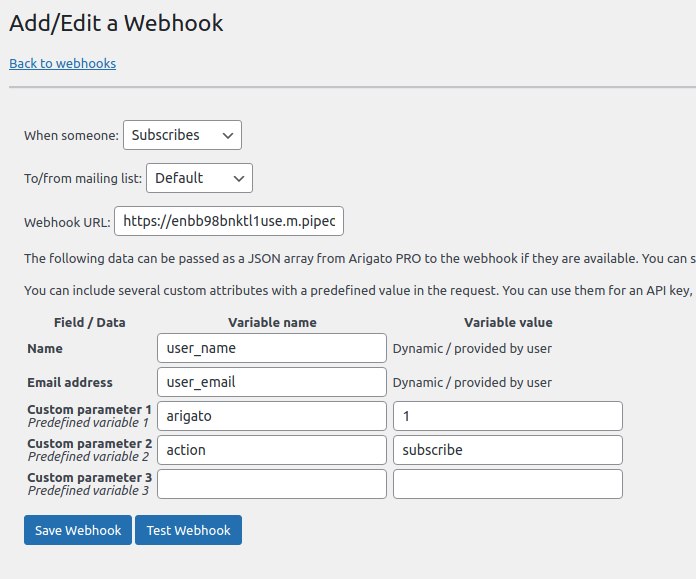
To get to the webhooks interface click on the Webhooks / Zapier link in your Arigato PRO menu. From there you will be able to add multiple hooks for each mailing list. Here is for example how it looks:

adding a Zapier webhook in Arigato PRO

Using the above example, the hook will be fired each time when someone subscribers to our “Default” mailing list. The data that will be sent to Pipedream (you can use it for testing and more) is this:

Testing webhooks in Arigato PRO


Pipedream lets you test your hooks and see the JSON message that you have sent to them. In real usage this data will be used by other apps to do all kind of things with it.

Please don’t forget to respect any privacy laws your country. We are only providing the technology to connect to webhooks but cannot give you a legal advice.