This short visual guide will clarify the common misconceptions about using “category grades” in WatuPRO.
Note: Creating category grades is optional. You can show category performance with points and percent correct answers even without creating category grades. Just skip step 2 and don’t use the grade variables in step 3 (but feel free to use any other variables).
If you prefer watching a video, here’s a 3 minutes video tutorial that shows you the most important things. For full details please still read the documentation on this page.
Here is the procedure step-by-step:
Step 1. Make sure you have question categories.
Category grades make sense only if you have categorized the questions in your test. Typically you will have at least two question categories.
Step 2. Create your grades.
Creating category grades is optional. You can show category performance with points and percent correct answers even without creating category grades.
Go to the Grades page for the exam and select the desired question category you want to create grades for. The page will reload and then you can create and manage the grades for the category.

The category grades look just like the “whole exam” grades. If you use points and not % good answer don’t forget to consider only the possible sum of points within the category, not the total points of the whole exam.
Step 3. Create the category grade output
Under the drop-down selector there is a link “Design the common category grade output for this quiz”. Click on it to open a box like the one shown below:
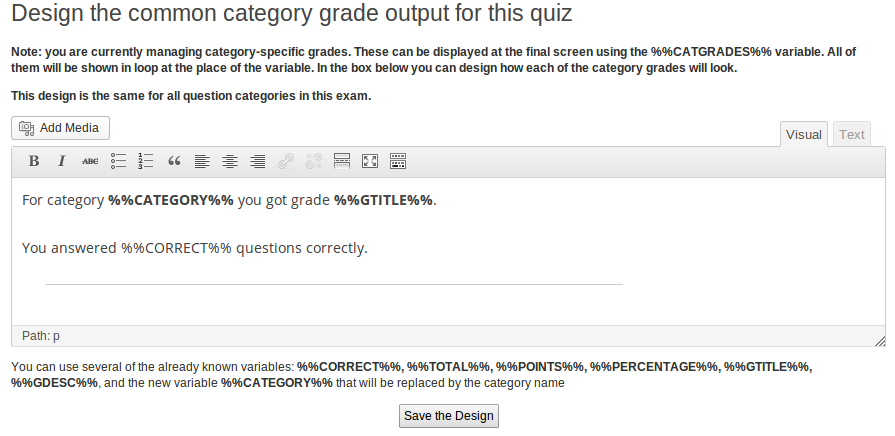
Note the variables listed below. Some of them are the same as on the “Final screen”, but not all.
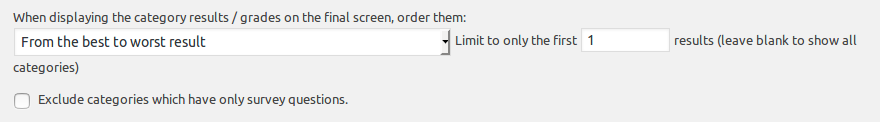
On the same page under that box you can control how the categories are ordered and how many of them to show:
This whole design will be repeated once for each category when you use the %%CATGRADES%% variable on the “Final screen”.
On the same section you can select that subcategories will sum up their performance into their parent categories. If this is selected the subcategories will not be included in the %%CATGRADES%% loop variable.
Step 4. Display category grades on the Final screen.
You simply need to include the %%CATGRADES%% variable as shown below:
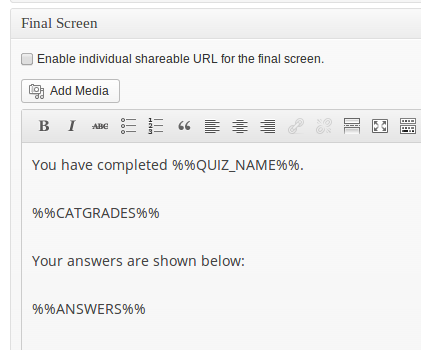
The variable will be populated with the output you designed in step 2, and it will be repeated once for each question category used in the quiz.
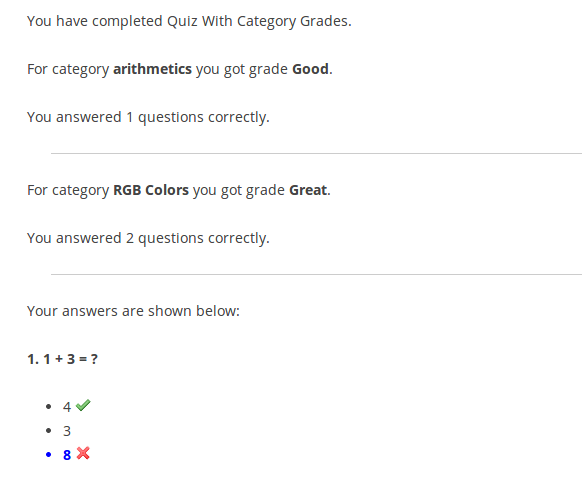
Here is how the output would look like:
Manually Craft The Output
As you see, by default %%CATGRADES%% is automatically replaced by your content in a loop.
Sometimes you may want to manually design this output so you can arrange the categories in different way. You can do it this way:
1. Ignore the %%CATGRADES%% variable and the “category grade output” (steps 3 and 4 above).
2. Instead of this use the following variables directly in the “Final page / Quiz output” box:
%%CATEGORY-NAME-X%%
%%CATEGORY-DESCRIPTION-X%%
%%CATEGORY-CORRECT-X%% (no. correct answers given in the category)
%%CATEGORY-WRONG-X%% (no. wrong answers given in the category, from WatuPRO 6.4.5.5)
%%CATEGORY-EMPTY-X%% (no. unanswered questions in the category, from WatuPRO 6.4.5.5)
%%CATEGORY-TOTAL-X%% (total number of questions answered in the category)
%%CATEGORY-POINTS-X%% (points collected in the category)
%%CATEGORY-PERCENTAGE-X%% (% correct achieved)
%%CATEGORY-GTITLE-X%% (grade title of the assigned grade, if any)
%%CATEGORY-GDESCRIPTION-X%% (grade description, if any)
%%CATEGORY-PERCENTAGEOFMAX-X%% (% from maximum points in that category collected, variable available from WatuPRO v. 5.0.8.1)
%%CATEGORY-ANSWERS-X%% (the %%ANSWERS%% variable only for this category, added in WatuPRO 6.6.9)
%%CATEGORY-UNRESOLVED-X%% (the %%UNRESOLVED%% variable only for this category, added in WatuPRO 6.6.9)
Note that X is the Category ID. You can see all category IDs at the “Question categories” page.
From WatuPRO version 5.8.4.5 the variables that you see in bold can also be used directly in certificates. The variables that are NOT bold will work only if you have explicitly selected the option “Store full category grades along with the results” at the Edit Quiz -> Advanced Settings tab, section “Advanced Workflow Settings”. Note that this selection can result in large database space usage.
Creating Charts
If you have the Reporting Module installed you can create a chart like this:
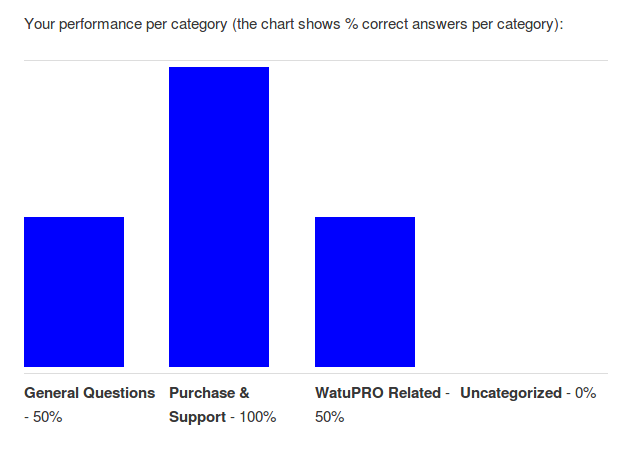
Simply embed the shortcode watupror-user-cat-chart. It accepts some parameters explained in the internal Help page of the plugin.
Since version 6.2.2.5 the plugin with the Reporting module can also generate two pie charts:
The points based pie chart shows the points collected per question category:
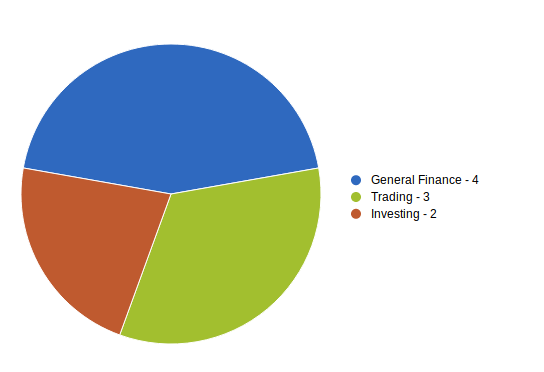
The shortcode to display the above chart is [watupror-pie-chart radius=150 from="points"]. The “radius” parameter is optional and defaults to 100 (pixels).
The same shortcode but used with attribute from=”correct” will display one pie for each question category, showing percent correct vs. percent wrong answers:
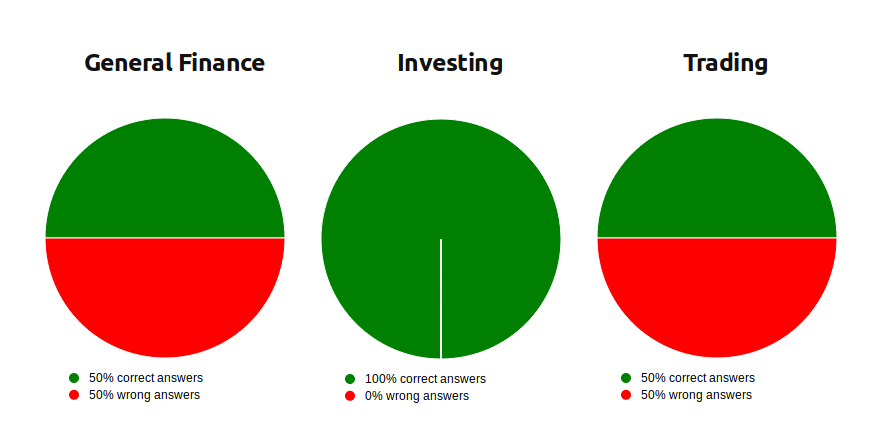
When from=”correct” you can also pass draw_unanswered=1 to generate charts with 3 sectors – for correctly answered, wrongly answered, and unanswered questions. Example:
[watupror-pie-chart radius=150 from="correct" draw_unanswered=1]
(the above parameter is available from WatuPRO 6.4.6)
You can learn about all available charts in the Reporting module here.
Pie Charts in Email and PDF
Note that the pie charts shown above are JavaScript based and won’t be displayed in email sent to user neither in PDF output. There is a solution for this: if your server has the GD library installed (most web hosts have it), you can use the GD version which produces real images.
To use this mode you need to pass attribute mode=”gd” to the shortcode, for example like this:
[watupror-pie-chart radius=150 from="points" mode="gd"].
Myers-Briggs Personality Tests
A newer and probably better way of creating Myers-Briggs tests is explained here.
Using this feature with manually crafting the output is also a way to create Myers-Briggs personality tests. Here’s how to do it:
- Place your questions in five categories (for example Mind, Energy, Nature, Tactics, Identity)
- Create different category grades for each category. For mind you can have grades Extraverted and Introverted (use only the letters for grade title: E and I), for Energy Intuitive and Observant etc.
- In the final screen construct the 5 letter personality types by combining the grade titles of the 5 categories: %%CATEGORY-GTITLE-1%%%%CATEGORY-GTITLE-2%%%%CATEGORY-GTITLE-3%%%%CATEGORY-GTITLE-4%%-%%CATEGORY-GTITLE-5%%
- Then if you wish you can construct the explanation text from the descriptions of all category grades similar to how you constructed the title above
Test Grade Based on Question Category Performance
From 5.5.8 you can define final test grade which depends on the performance of each question category. This is the best way to handle complicated and non-standard tests. Learn more about this feature here.
Troubleshooting
Problem: Not all categories appear on the final screen.
Solution: This happens because you have added questions from categories whose order is not yet defined.Simply re-save the quiz and everything will be fine. If you want to change the category order you can do it from the Advanced Settings tab of the quiz.