From version 6.5.6 there are 3 new charts in the Reporting module of the quiz and survey plugin WatuPRO.
Quick links: Basic performance chart | Question performance chart |Cumulative poll chart |Charts per question category |All respondents performance | Pie Chart from Correct / Wrong / Unanswered | Charts in My Quiz Reports pages
Basic Performance Chart
This is a simple chart showing your points collected vs. the maximum points that you could achieve in a single quiz attempt. The chart can be used in the quiz final screen but for logged in users you can also use it elsewhere as long as you pass the attribute quiz_id as documented later below.
Chart shortcode: [watupror-performance-chart]
Attributes (all optional):
- type – “bar” or “pie”. Defaults to bar (and generates a barchart)
- mode – “js” (default) or “gd”. Used only if type is “pie”. Normally the chart is generated via the gRaphael javascript charting library. However if you plan to include it in email contents or allow PDF download of the final screen (using our PDF bridge), then you should set mode to “gd”. This will use the PHP GD library which must be installed on your server.
- taking_id – use it if you want to show a chart for a specific quiz attempt. Usually you will display the chart on the final screen so taking_id is based on the current attempt. In this case the attribute should not be passed.
- quiz_id – used in case you want to show chart for the latest attempt of the currently logged in user on a specific quiz. Normally (showing chart on the final screen) you will skip this attribute.
- your_color – the color of the bar or pie slice which displays the points you have collected. Pass a valid hex value like #FF0000 (no short syntax).
- max_color – the color of the bar or pie slice which displays the maximum points that could be collected on that attempt. Pass a valid hex value like #FF0000 (no short syntax).
- your_text – the text shown under your points bar or pie slice. Has default value for both chart types.
- max_text – the text shown under the maximum points bar or pie slice. Has default value for both chart types.
- bar_width – the width of each bar in pixels. Defaults to 100. Used only if type = “bar”.
- height – the height of the highest bar in pixels. Defaults to 300. Used only if type = “bar”.
- radius – the radius of the pie in pixels. Defaults to 100. Used only if type=”pie”.
Let’s see a couple of example usages so you get a better idea of this chart:
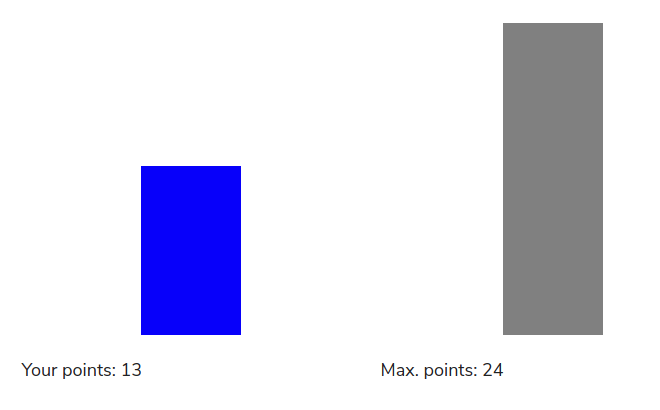
Shortcode used: [watupror-performance-chart] (all defaults, no parameters)
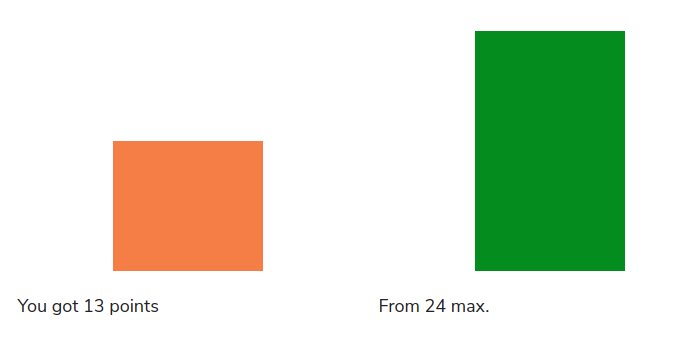
Shortcode used: [watupror-performance-chart your_color="#f57e42" max_color="#038a05" height="250" bar_width="150" your_text="You got %d points" max_text="From %d max."]
Above is an example of the barchart with custom colors, text, and sizes.
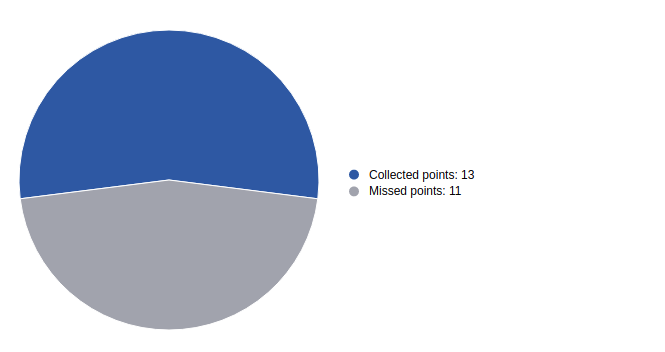
Shortcode used: [watupror-performance-chart your_color="#2d5ba6" max_color="#a1a3ad" type="pie" radius=150]
Note that the pie chart is slightly different. The whole 360° represent the maximum points on the quiz. That’s why the two colors actually show points collected and points missed which is made clear by the default texts.
Questions Performance Chart
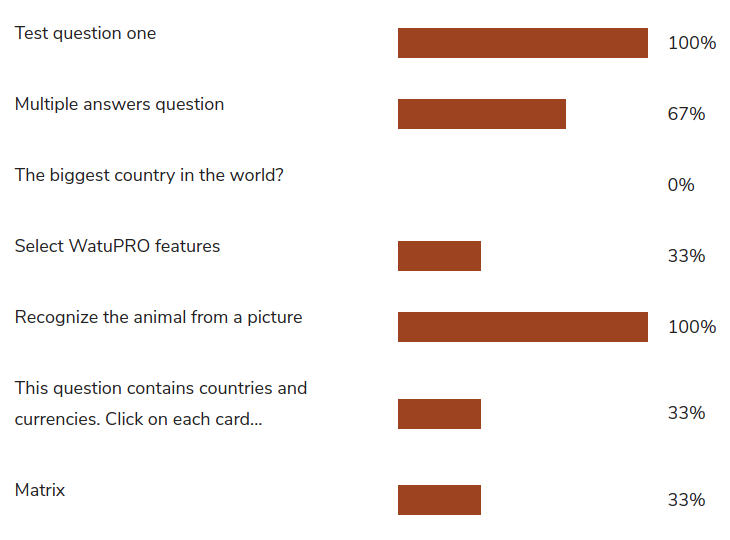
Similar to the above chart, this one shows your points as a percentage of the maximum points but for every question answered in the quiz.
It’s currently available only as a horizontal bar chart.
Chart shortcode: [watupror-questions-performance-chart]
Attributes (all optional):
- taking_id – use it if you want to show a chart for a specific quiz attempt. Usually you will display the chart on the final screen so taking_id is based on the current attempt. In this case the attribute should not be passed.
- quiz_id – used in case you want to show chart for the latest attempt of the currently logged in user on a specific quiz. Normally (showing chart on the final screen) you will skip this attribute.
- color – the color of the bars.
- bar_width – the width of each bar in pixels. Defaults to 30. Note that because the chart is horizontal the “width” of the bar actually means it’s size vertically.
- height – the height of the highest bar in pixels. Defaults to 300. Note that because the chart is horizontal this actually means the size of the bar horizontally.
Here is an example of this chart using a custom color:
Cumulative Poll Chart
This is a cumulative chart from everyone’s answers on a single question. By default it loads “correct/incorrect” chart on all question types except on “single answer” and “multiple answer” questions where it loads one bar per each answer.
You can force it to always show correct / incorrect by adding parameter to the shortcode: [watupro-poll question_id="X" mode="correct"].
You can also control the colors used in the chart like this: [watupror-poll question_id="X" correct_color="green" wrong_color="#FF0000"].
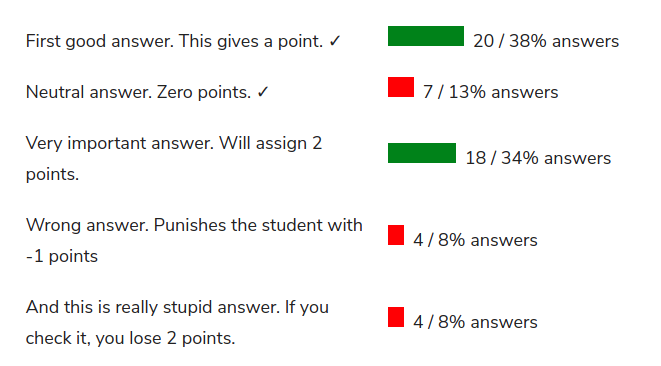
The optional parameter user_choice lets you show which is the current user answer when the shortcode is used in the “Final page”. You can pass any text or even HTML code (when using HTML make sure the rich text editor is in Text mode) and it will be shown next to the corresponding answer(s) or correct / incorrect stats. If you pass “CHECK” to the attribute we will generate a checkmark.
Example: [watupror-poll question_id=”X” user_choice=”CHECK”]
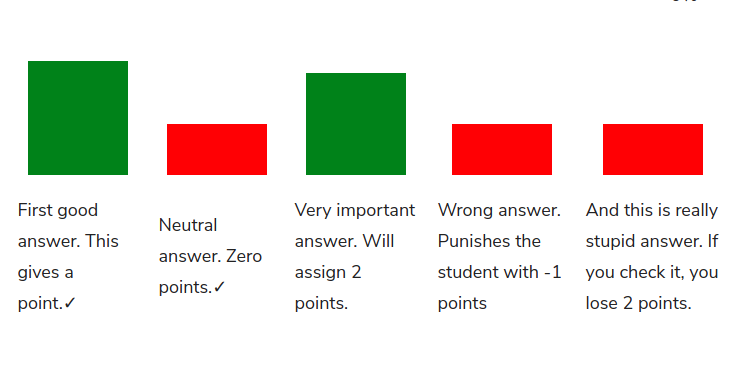
By default the shrotcode produces a horizontal bar chart. You can use the parameter “orientation” to make it a vertical one.
Example: [watupror-poll question_id="X" orientation="vertical"]
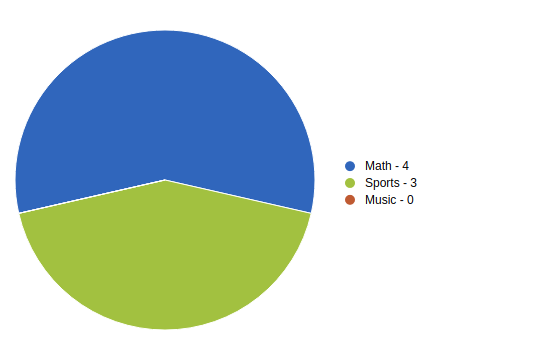
Performance Per Categories
The chart showing user’s performance per question category in a single quiz attempt has several variations – a bar chart, a pie chart, multiple pie charts based on % correct / % wrong answers in each question category.
Here is a basic example:
You definitely need to read the whole article about this chart to find all the variations and possibilities it gives.
This same chart can show performance per question categories of a logged in user on all tests. To switch to this mode pass the attribute taking_id=”ALL” to the shortcode.
Everyone’s Performance Per Question Category
This chart works similar to user’s performance per question category but shows everyone’s. The chart can be used on a random post or page (does not need to be on the quiz final screen).
The shortcode accepts exactly the same parameters as the user category chart but requires the parameter quiz_id. Note that drawing the chart for a quiz that has been completed by tens of thousands of users may require a lot of server memory.
The parameter sum_subcategories=1 will sum up the subcategory performance into the parent categories and will not generate pies for the subcategories.
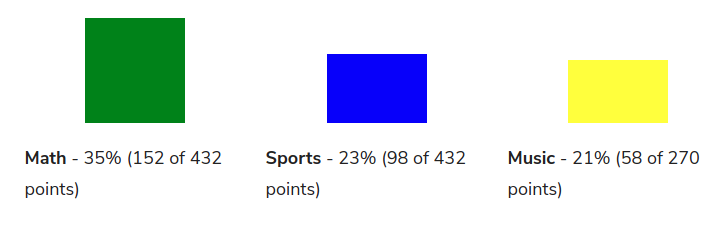
Here’s example shortcode usage:
[watupror-quiz-cat-chart quiz_id=X from="percent_max_points" colors="green, blue, yellow, black, orange"]
Your vs. Everyone’s Performance Per Question Category
Use the same shortcode as above but pass the parameter “compare=1”. It will produce two bars for each question category – one for you (current taking or passed parameter taking_id) and one for everyone’s performance.
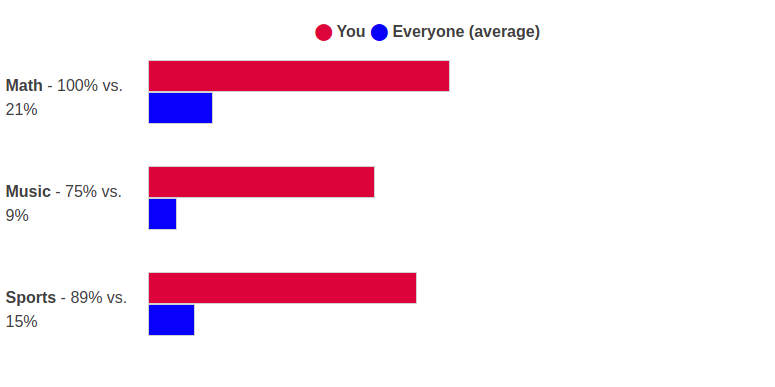
With this shortcode you need to pass only two colors in the “colors” parameter. The color of your bar and the color of everyone’s bar.
Here is the shortcode that produced the above chart:
[watupror-quiz-cat-chart quiz_id=X from="percent_max_points" colors="crimson, blue" compare="1" width="30" orientation="horizontal"]
Available from WatuPRO 6.5.8.6.
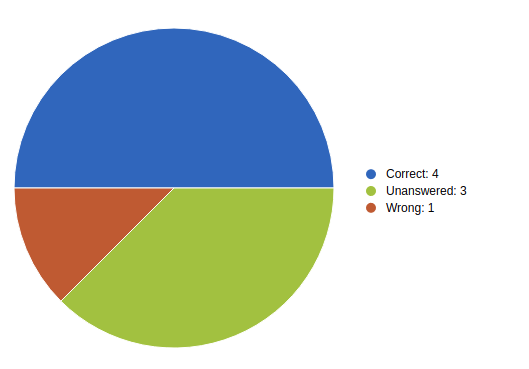
Pie Chart from Correct / Wrong / Unanswered
This is a simple chart based on a single quiz attempt. It shares the same watupror-pie-chart shortcode which generates the performance per category chart above but with parrameter from=”questions”.
Example usage: [watupror-pie-chart from="questions" radius="160"]
Charts Inside “My Quiz Reports” Page
Additionally the Reporting module provides several pages that contain detailed reports for each registered test taker. Each user can see it’s own performance reports and charts. The admin can see everyone’s (see how).
These pages contain a couple of charts too:
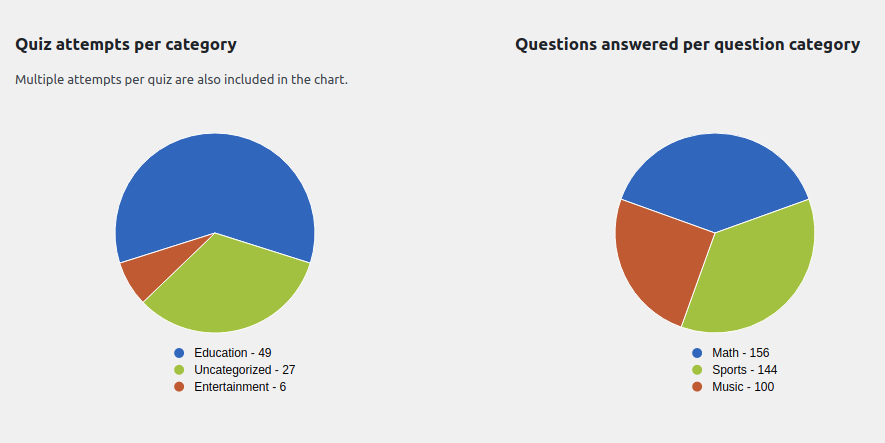
These charts are showing all time overview of taken tests per test category and questions answered per question category.
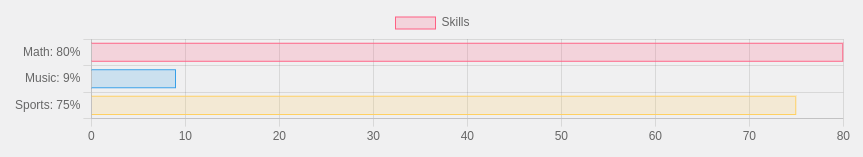
The above simple bar chart shows proficiency per skill / question category from the Skills report page. It can be horizontal and limited further per test and filtered for desired proficiency level.
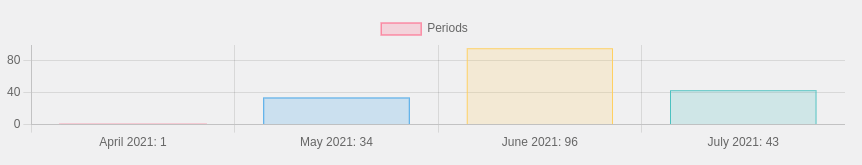
The history bar chart shows the number of quizzes attempted in total for each month of the current year.