The quiz and survey plugin WatuPRO is starting to get into data science. Here’s one of the most useful features you will not see in many others, if any, survey and quiz plugins: cross tabulation analysis.
If you would like to learn more, I recommend you to visit this page.
This feature is available from WatuPRO (with the Reporting Module installed) version 6.5.1.5. Go to “View results” page on any test and you will see “Cross Tabulation” link on top along the other links. Clicking on it will take you to a page where all single-answer and multiple-answer questions are available to cross-reference. Let’s see how this looks with our very simple 3 questions survey:
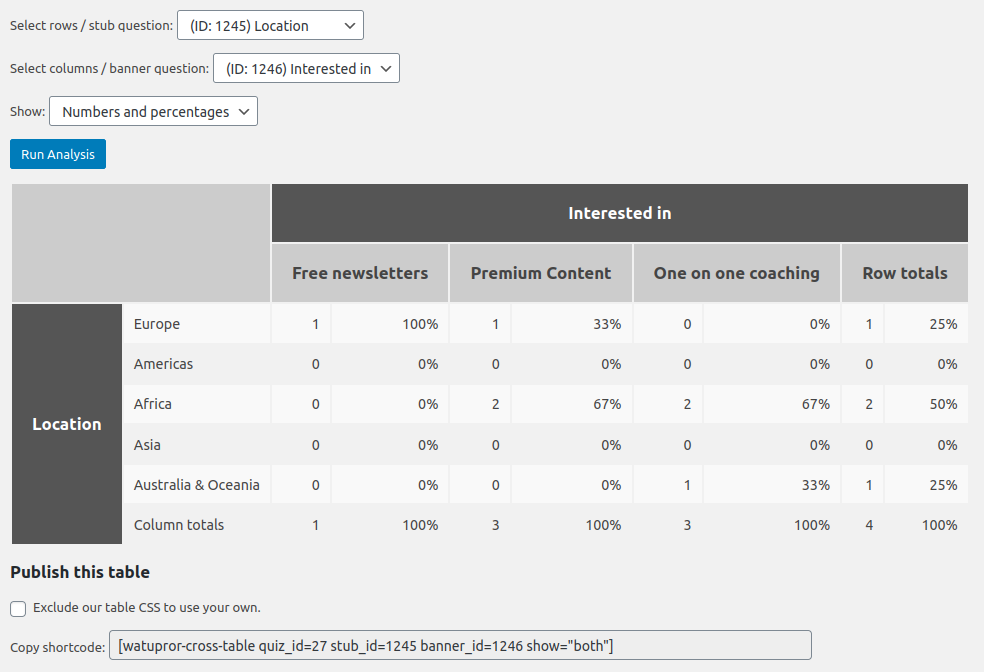
We have asked the respondents 3 questions: gender, location and what they are interested in. For the last question they could choose more than one answer.
Cross tabulation lets us intersect any two questions in the survey and can give us super useful insights. In the above simple example we can see how many users from each location are interesting in each of our offerings.
Note: the row total for Africa seems wrong? Nope, it’s correct. Our two respondents from Africa have selected both premium content and one on one coaching. So indeed there are only two respondents from this region.
You can see the same analysis by gender:
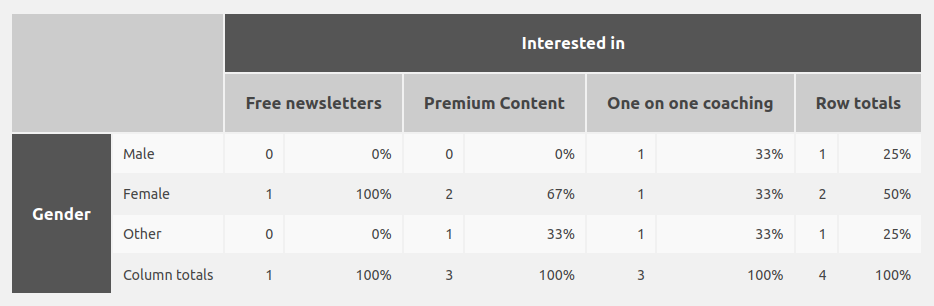
And again it may look like the row total for females in incorrect, but no, it isn’t. There are two female respondents but they have selected more than one answer.
The cross tabulation analysis can be turned any way, for example to have the offerings at left: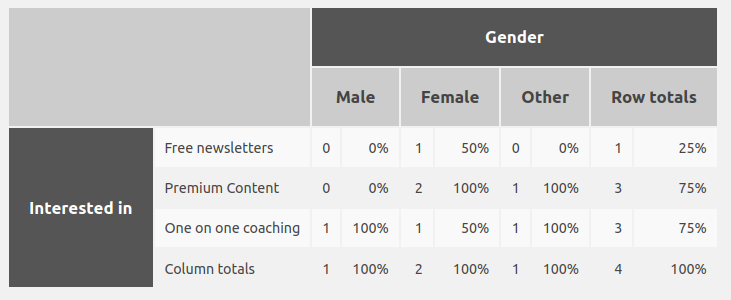
Its the same data but makes the table a bit more compact. This is entirely a matter of preference.
Every table that you generate can be published on the front-end using the shortcode shown under it: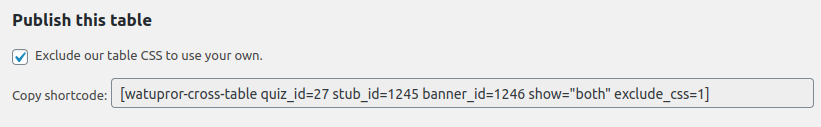
You may want to exclude our CSS if it doesn’t look good on the front-end, and apply your own or just let it follow the standard table CSS defined by your theme.
Note that depending on the size of this data calculating cross table analysis could be resource intensive. While this won’t be a problem on the back-end where only you and maybe a handful of mates are looking, it could be a problem if you use the shortcode on a popular blog post. For this reason we recommend caching the pages that contain the cross-table shortcode.
And that’s just the beginning of turning WatuPRO into a super valuiable tool for surveys and data analysis. So stay tuned for what’s to come.