From version 2.5.6 the WordPress learning management sytsem Namaste! LMS supports webhooks & Zapier integration.
You can learn more about Zapier’s implementation of webhooks here.
Currently Supported Actions
At the moment Namaste! LMS allows you to attach hooks to the following actions:
Student enrolls in a course. This happens for auto-approved enrollments or enrollments made by admin. It will also be fired when a pending enrollment is approved.
Student completes a course.
Webhooks can be used to connect your LMS to mailing list services, CRM, or any other web based services that support webhooks directly or through Zapier (or similar products).
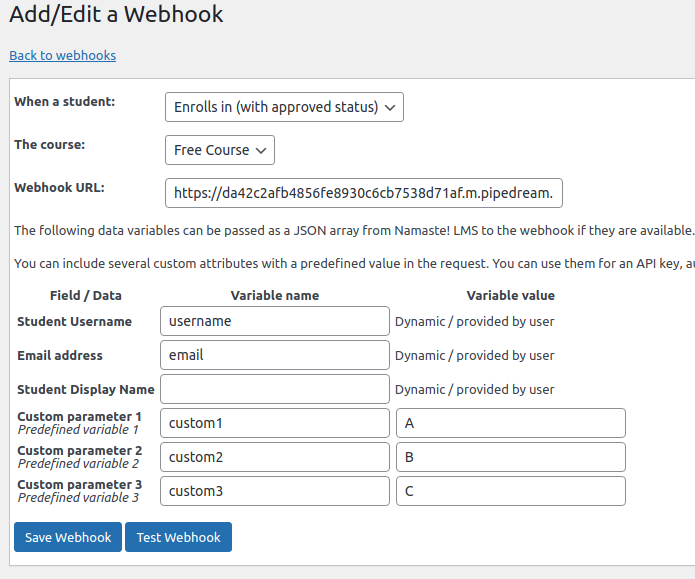
To get to the webhooks interface click on the Webhooks / Zapier link in your Namaste! LMS menu. Here is the interface that you’ll see when adding a webhook:
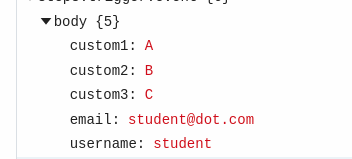
With the above example you will have your webhook notified when someone successfully enrolls in the Free course. The hook will send username, email, and 3 fixed custom parameters. The data that will be sent to Pipedream (you can use it for testing and more) is this:
Pipedream lets you test your hooks and see the JSON message that you have sent to them. In real usage this data will be used by other apps to do all kind of things with it.
Stay tuned for more webhook events powered by the Namaste! Connect module soon.
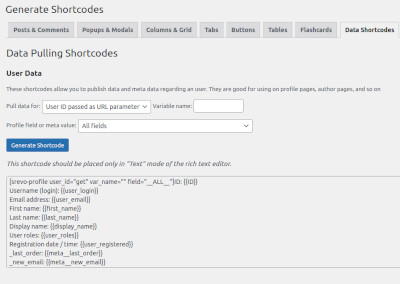
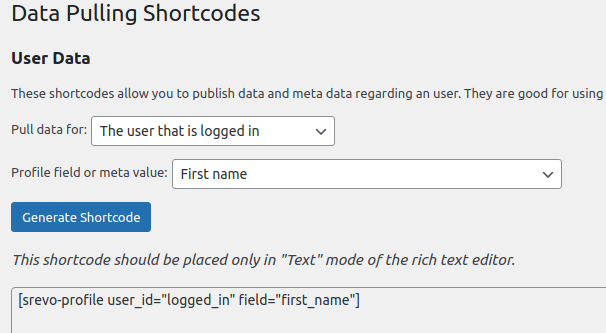
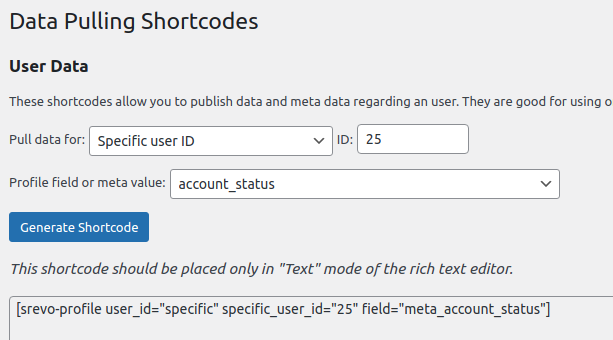
The Data Shortcodes tab in the Shortcode Revolution plugin is simple but powerful way to build profile pages, greetings, widgets with user stats, and so on. It has 3 ways to specify the user whose data we’ll be showing:
Currently Logged User
Probably the simplest and most frequent use will be to get data for the currently logged in user and do something with it. A simple example is just a greeting:
You can get this shortcode and place it in a widget like this for example:
This usage is less common inside a post or widget because you will rarely have such fixed content for each of your users in the system. It is however very useful if you are doing something with programming in your theme. In this case you can dynamically pass the user ID. Something like this:
* Please note that the above example assumes you have created the variable $current_user_id. If not, you can use the built-in WP function get_current_user_id().
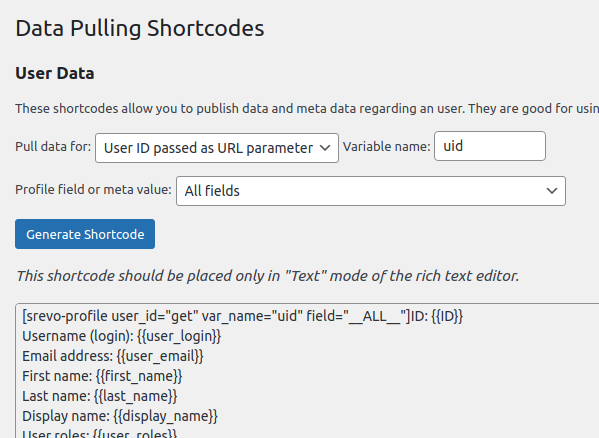
User ID Passed by URL Parameter
This is the most powerful way to use the data shortcodes and it works great when you are creating dynamic profile pages or other pages which display data for all users.
In this example we are building a profile page (obviously we have not formatted anything in the enclosed content in the shortcode. But you can nicely format a table or other user interface with colors, font formatting, etc.
The important thing here is the variable name field. You can use any variable – in our example it is called “uid”, but you can use “user_id”, “member_id” or whatever you like. You can then load the profile data by passing this variable in the URL of the page where you have published the shortcode. For example let’s assume you have published the shortcode in this URL:
https://blog.calendarscripts.info/user-profile/
Then going to https://blog.calendarscripts.info/user-profile/?uid=25 (if you have used the variable name “uid”) will show the data for user with ID 25.
Let’s create a very simple example of how you can use this in a page that lists all users in your system. The page could be created with a custom shortcode or a theme function:
<?php
// let's assume you have existing array of members in $members
foreach($members as $member) {
   echo '<p><a href="'.add_query_arg(['uid' => $member->ID], 'https://blog.calendarscripts.info/user-profile/').'">'.$member->display_name.'</a></p>';
}
During our work on various WordPress installations I have figured out that we repeatedly create (oh well, kind of copy/paste) layout elements, dynamic stuff like lightboxes and sliders, pieces of code in custom plugins, and so on.
Some of these codes slowly turned into a library so we decided to go ahead and package them into a new free plugin called Shortcode Revolution. (You can check it at our site or directly at the WordPress repo)
This is just a very first version so there is hopefully a lot more to come. But let’s have a brief look at what’s available:
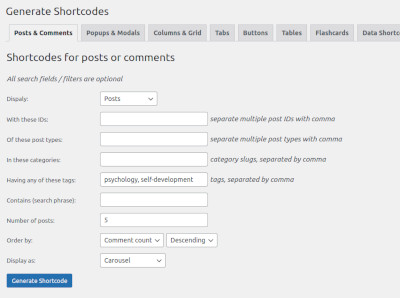
Posts, Related Posts, and Comments
This allows you to create widgets that contain posts related to a topic, searched by ID or tag, related to the currently shown post, and so on.
There are 3 handy layout modes: simple list, default (with a thumbnail and excerpt), and a carousel / slider.
From version 4.7.8 the WordPress quiz plugin WatuPRO supports a new question type – slider / rating. Here is how it looks on the front-end: The slider can have any range. In this example we have selected from 1 to 100. Slider questions often don’t need correct or wrong answers, but if you want to […]
While working on the new version of Shortcode Revolution we faced a couple of confusing behaviors of WordPress functions. I’ll document them here and will keep adding such information. Hopefully it can help other developers and save them a lot of time and frustration. Excluding posts from WP Query (using post__not_in) There is a good […]
A new shortcode in WatuPRO (from version 5.6.2.1) lets you perform basic math on two of the user’s answers. This shortcode should be used only in the “Final screen” of a test. Here is the shortcode with all its possible parameters: Attributes: math (required) shows the math you want to perform. […]
And above this paragraph you see a slider / carousel of 3 posts related to this one.
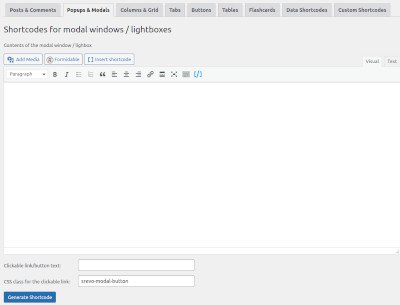
Popup / Lightbox
This is such a frequent task, and this plugin really makes it easy. Just enter your contents, some clickable text and probably some custom CSS classes. Voila, the popup is created.
How about some cool content here, describing more about what I am talking about?
I mean, it’s typical that the content on the web normally just stays in one column. But who said it should always be that?
Do you remember newsletters? I hope our readers are not all that young. Newsletters (the paper ones!) typically have content flowing in multuple columns. That’s not typical for the web not because it’s bad but because it was hard thing to do in the past.
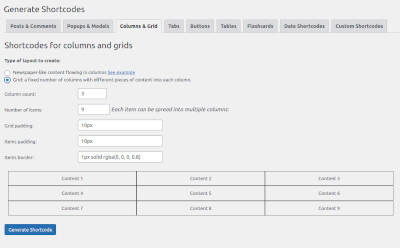
Now with the new CSS techniques it’s not that hard. But you don’t always want to write CSS especially when you are writing a blog post, do you? This is where the columns shortcode comes handy!
The shortcode also allows you to create a grid. In the grid the content does not flow in the columns. Instead, each piece stays in its own grid cell. Like this:
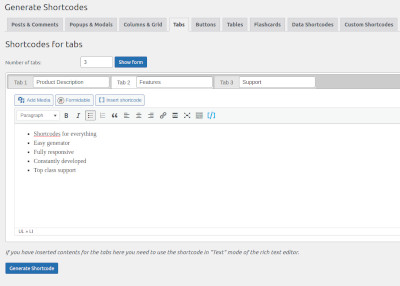
As I told you, you can arrange content in tabs 🙂 Just click on one of these tabs and you’ll see the content related to each one.
Let’s just have a chart here to look smart.
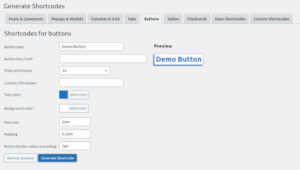
Buttons
There isn’t so much to explain here. You get an easy to use UI to create all kind of buttons.
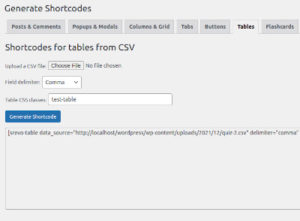
Tables
This one is super simple – it creates table from an uploaded CSV file. Technically you can use a remove or a dynamic CSV as well – just replace the uploaded file URL with the remote one.
Tables aren’t that much fascinating – I am sure you have seem some! So no demo for this shortcode.
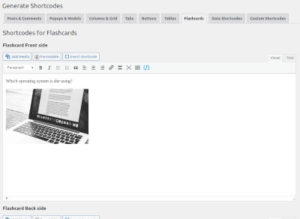
Flashcards / Flipcards
There cards have a front and a back side and reveal the back when the user clicks on them. Simple:
Here’s a Math task:
2 + 2*3?
Of course it’s 8 because multiplication has a higher priority than addition 🙂
Who is she?
Adriana Lima
You can even combine shortcodes together like I did above. I placed two flashcard shortcodes in a grid so they can be side by side.
Data Shortcodes
They are excellent for creating profile pages in communities, author pages, widgets containing some user data, and so on.
Custom Shortcodes
Just any content that you may want in many places on your site. Custom HTML, shortcodes, media, formulas, whatever. Easily repeatable and editable in one place.
Enjoy the plugin – it’s free and can save you many hours of work. Let us know your feedback, feature requests, and bug reports (yes, even bug reports!).
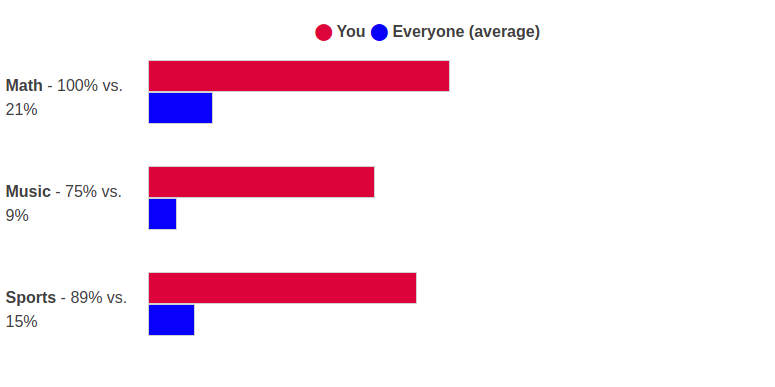
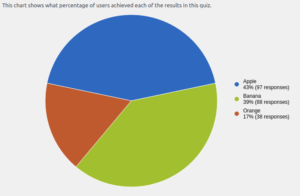
 Let’s just have a chart here to look smart.